2025-05-30 - Dev Log 1
Tldr
Honestly, if you’re just reading through this on my site; you can probably skip this one and move on to dev log 2. This is just me having a 3 hour fist fight with my development environments and different libraries until I got something runnable. Understanding and practical applications are scarce here… lol
Environment Configuration
Linux
Setting this up worked exactly how I expected on my Debian server:
cd /home/hoid/projects
git clone https://git.c0smere.net/wes/portfolio_zenml_e2e.git
cd portfolio_zenml_e2e

python3 -m venv .venv
source .venv/bin/activate
pip install zenml
Windows
Was annoying, go figure. Need to add notes
Setting up zenml server on my server with Docker
mkdir /mnt/storage/WES/zenml-server

docker run -it -d -p 18080:8080 --name zenml \
    --mount type=bind,source=/mnt/storage/WES/zenml-server,target=/zenml/.zenconfig/local_stores/default_zen_store \
    zenmldocker/zenml-server
# telling zenml on my development machine to use this new server
(.venv) PS > zenml connect --url http://192.168.88.5:18080
zenml status
-----ZenML Client Status-----
Connected to a remote ZenML server: `http://192.168.88.5:18080`
Dashboard: http://192.168.88.5:18080
API: http://192.168.88.5:18080
Server status: 'None'
Server authentication: never expires
The active user is: 'hoid'
The active project is: 'default' (repository)
The active stack is: 'default' (repository)
Active repository root: C:\Users\wes\projects\portfolio_zenml_e2e
Using configuration from: 'C:\Users\wes\AppData\Roaming\zenml'
Local store files are located at: 'C:\Users\wes\AppData\Roaming\zenml\local_stores'
-----Local ZenML Server Status-----
The local server has not been started.
(.venv) PS > zenml stack list
┏━━━━━━━━┯━━━━━━━━━━━━┯━━━━━━━━━━━━━━━━━━━━━━━━━━━━━━━━━━━━━━┯━━━━━━━┯━━━━━━━━━━━━━━┯━━━━━━━━━━━━━━━━┓
┃ ACTIVE │ STACK NAME │ STACK ID │ OWNER │ ORCHESTRATOR │ ARTIFACT_STORE ┃
┠────────┼────────────┼──────────────────────────────────────┼───────┼──────────────┼────────────────┨
┃ 👉 │ default │ 25e2a8ab-ba9f-4fd5-8e2c-f18fd65eafa7 │ - │ default │ default ┃
┗━━━━━━━━┷━━━━━━━━━━━━┷━━━━━━━━━━━━━━━━━━━━━━━━━━━━━━━━━━━━━━┷━━━━━━━┷━━━━━━━━━━━━━━┷━━━━━━━━━━━━━━━━┛lmao that stack list output looks like shit in here; oh well.
Random Thoughts
Type hinting in python
I haven’t actually developed anything in python using type hints. Coming full circle from using jython a decade ago to execute code in Java libraries without giving a shit about type safety lmao. Type hints in python seem to be optional static typing specifications.
From the zenml tutorial:
@step
def training_data_loader() -> Tuple[
    # Notice we use a Tuple and Annotated to return
    # multiple named outputs
    Annotated[pd.DataFrame, "X_train"],
    Annotated[pd.DataFrame, "X_test"],
    Annotated[pd.Series, "y_train"],
    Annotated[pd.Series, "y_test"],
]:
    """Load the iris dataset as a tuple of Pandas DataFrame / Series."""
    logging.info("Loading iris...")
    iris = load_iris(as_frame=True)
    logging.info("Splitting train and test...")
    X_train, X_test, y_train, y_test = train_test_split(
        iris.data, iris.target, test_size=0.2, shuffle=True, random_state=42
    )
    return X_train, X_test, y_train, y_test
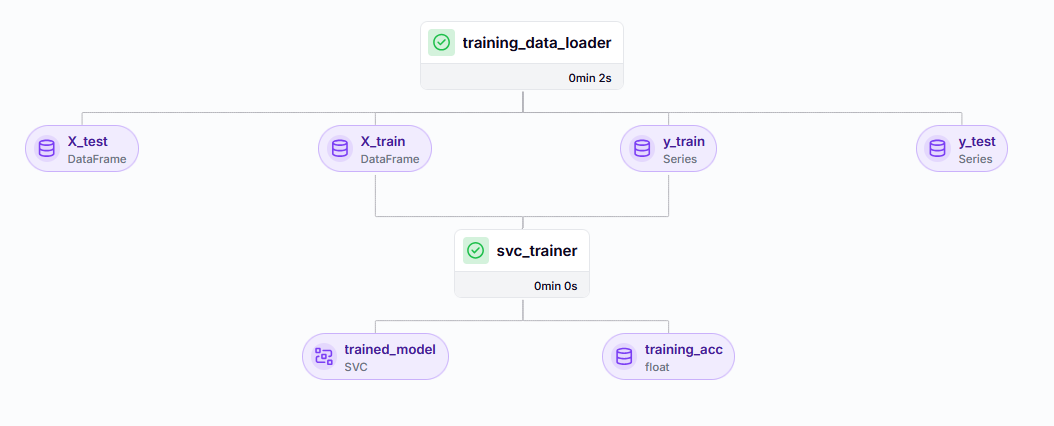
Essentially defining a return type here of a Tuple containing 4 pandas dataframes.
Important
The
Annotatedbit is quite interesting: https://docs.python.org/3/howto/annotations.html Objects in python have a annotationdictinternally for storing metadata. I assume zenml makes heavy use of this
Notice how in the next step we’re using type hints to explicitly define the type of each of the function’s parameters (and reusing the names defined in the return type of the first step where relevant)
@step
def svc_trainer(
    X_train: pd.DataFrame,
    y_train: pd.Series,
    gamma: float = 0.001,
) -> Tuple[
    Annotated[ClassifierMixin, "trained_model"],
    Annotated[float, "training_acc"],
]:
    """Train a sklearn SVC classifier."""

    model = SVC(gamma=gamma)
    model.fit(X_train.to_numpy(), y_train.to_numpy())

    train_acc = model.score(X_train.to_numpy(), y_train.to_numpy())
    print(f"Train accuracy: {train_acc}")

    return model, train_acc
Zenml speculations
Looking at the final part of the second example:
@pipeline
def training_pipeline(gamma: float = 0.002):
    X_train, X_test, y_train, y_test = training_data_loader()
    svc_trainer(gamma=gamma, X_train=X_train, y_train=y_train)


if __name__ == "__main__":
    training_pipeline(gamma=0.0015)
Seems to me that the @step decorator supports the functionality in the dashboard for running steps individually. You combine all steps for a given pipleline into 1 function and tag that with @pipeline to actually define a pipeline.
Yep the type hinting annotations are what drives a lot of the zenml dashboard functionality:
# Configure the pipeline
training_pipeline = training_pipeline.with_options(
    config_path='/local/path/to/config.yaml'
)
# Run the pipeline
training_pipeline()
looks like the @pipeline decorator also bestows functions with some other functions like with_options() above which lets you specify parameter values in a yaml file.
@step also provides this for step functions
parameters:
    gamma: 0.01
Tip
Using the
Annotatedobject to properly name things (steps,pipelines) makes managing theartifcats(the outputs of steps and pipelines)in the dashboard a lot easier later on
List artifacts:
zenml artifact version list
Project Design
Putting postgres credentials in the secret manager
zenml secret create postgres_credentials \
    --host="192.168.88.5" \
    --port="5432" \
    --dbname="gp0" \
    --username="username" \
    --password="password"
Bare minimum single-step script that loaded my rolling24 data successfully:
import pandas as pd
from sqlalchemy import create_engine
from zenml.steps import step
from zenml.client import Client

POSTGRES_SECRET_NAME = "postgres_credentials"

@step
def query_postgres_step() -> pd.DataFrame:
    # Fetch secret from ZenML Secret Manager
    secret = Client().get_secret(POSTGRES_SECRET_NAME)
    db_host = secret.secret_values["host"]
    db_port = secret.secret_values["port"]
    db_name = secret.secret_values["dbname"]
    db_user = secret.secret_values["username"]
    db_password = secret.secret_values["password"]
    postgres_url = (
        f"postgresql://{db_user}:{db_password}@{db_host}:{db_port}/{db_name}"
    )

    # Create SQLAlchemy engine
    engine = create_engine(postgres_url)
    query = """
    SELECT period_start, period_end, duration, u_diff, d_diff, t_diff, u_rate, d_rate, t_rate, cap_bytes, pct_cap_util
    FROM "SECV_SCRAPE".rolling_24hr_summary;
    """

    # Execute query and load into DataFrame
    with engine.connect() as connection:
        df = pd.read_sql_query(query, connection)

    return df

if __name__ == "__main__":
    # Run the step standalone for testing
    df_result = query_postgres_step()
    print(df_result.head())
I ended up wasting like 2 hours battling with Great Expectations, I’m sure it’s very capable but god it seems so convoluted… I ended up going with the second search result I found pandera and had basic validation working in like 15 minutes…
@step
def validate_data(df: pd.DataFrame) -> bool:
    """
    Validates the input DataFrame using Pandera.
    """
    try:
        # Define the schema
        schema = pa.DataFrameSchema(
            columns={
                "period_start": Column(pa.DateTime, nullable=False),
                "period_end": Column(pa.DateTime, nullable=False),
                "duration": Column(pa.Timedelta, nullable=False),
                "u_diff": Column(pa.Float64, nullable=False),
                "d_diff": Column(pa.Float64, nullable=False),
                "t_diff": Column(pa.Float64, nullable=False),
                "u_rate": Column(pa.Float64, nullable=False),
                "d_rate": Column(pa.Float64, nullable=False),
                "t_rate": Column(pa.Float64, nullable=False),
                "cap_bytes": Column(pa.Int64, nullable=False),
                "pct_cap_util": Column(
                    pa.Float64,
                    nullable=False,
                    checks=[
                        Check.greater_than_or_equal_to(0),
                    ],
                ),
            },
            strict=True,  # Ensure no extra columns
            coerce=True,  # Coerce data types
        )

        # Validate the DataFrame
        schema.validate(df, lazy=False)  # lazy=False raises all errors at once

        print("Data validation successful!")
        return True

    except pa.errors.SchemaError as e:
        print("Data validation failed!")
        print(e)
        return False
    except Exception as e:
        print(f"Error during validation: {str(e)}")
        return False
Feature engineering
@step
def feature_engineering_and_lagging(df: pd.DataFrame, lags: list, cols_to_lag: list) -> pd.DataFrame:
    """
    Engineers time-based features, rolling 7-day statistics, handles missing values, and creates lagged features.
    """

    # 1. Time-Based Features (same as before)
    df["hour"] = df["period_start"].dt.hour
    df["day_of_week"] = df["period_start"].dt.dayofweek  # Monday=0, Sunday=6
    df["month"] = df["period_start"].dt.month
    df["quarter"] = df["period_start"].dt.quarter
    df["year"] = df["period_start"].dt.year
    df["day_of_year"] = df["period_start"].dt.dayofyear
    df["is_weekend"] = df["day_of_week"].isin([5, 6]).astype(int)  # 1 if weekend, 0 if not

    # 2. Rolling 7-Day Statistics (same as before)
    df = df.sort_values("period_start")
    numeric_cols = ["u_diff", "d_diff", "t_diff", "u_rate", "d_rate", "t_rate", "cap_bytes", "pct_cap_util"]
    for col in numeric_cols:
        df[f"{col}_rolling_mean_7d"] = df[col].rolling(window=7, min_periods=1).mean()
        df[f"{col}_rolling_std_7d"] = df[col].rolling(window=7, min_periods=1).std()
        df[f"{col}_rolling_min_7d"] = df[col].rolling(window=7, min_periods=1).min()
        df[f"{col}_rolling_max_7d"] = df[col].rolling(window=7, min_periods=1).max()
    df = df.reset_index(drop=True)

    # 3. Handle Missing Values (same as before)
    rolling_cols = [col for col in df.columns if "_rolling_" in col]
    df[rolling_cols] = df[rolling_cols].fillna(method="bfill")
    df[rolling_cols] = df[rolling_cols].fillna(method="ffill")

    # 4. Create Lagged Features
    for col in cols_to_lag:
        for lag in lags:
            df[f"{col}_lag_{lag}"] = df[col].shift(lag)

    # 5. Handle Missing Values in Lagged Features
    lagged_cols = [col for col in df.columns if "_lag_" in col]
    df[lagged_cols] = df[lagged_cols].fillna(method="bfill")
    df[lagged_cols] = df[lagged_cols].fillna(method="ffill")

    return df
Training a Random Forest model, does this make sense? Search me, I’m not a data scientist
@step
def model_training_and_evaluation(df: pd.DataFrame, target_col: str, test_size: float = 0.2) -> RandomForestRegressor:
    """
    Trains a Random Forest model on the engineered features and evaluates its performance.
    """

    # 1. Prepare the Data
    # Define Features and Target
    features = [col for col in df.columns if col not in [target_col, "period_start", "period_end"]]
    target = target_col

    # Split Data into Training and Testing Sets (Time-Series-Aware)
    X = df[features]
    y = df[target]
    X_train, X_test, y_train, y_test = train_test_split(X, y, test_size=test_size, shuffle=False)

    # Scale Features
    scaler = StandardScaler()
    X_train = scaler.fit_transform(X_train)
    X_test = scaler.transform(X_test)

    # 2. Choose a Model
    model = RandomForestRegressor(n_estimators=100, random_state=42)  # You can adjust hyperparameters

    # 3. Train the Model
    model.fit(X_train, y_train)

    # 4. Make Predictions
    y_pred = model.predict(X_test)

    # 5. Evaluate the Model
    mae = mean_absolute_error(y_test, y_pred)
    rmse = np.sqrt(mean_squared_error(y_test, y_pred))

    print(f"Mean Absolute Error (MAE): {mae}")
    print(f"Root Mean Squared Error (RMSE): {rmse}")

    # Optional: Plot the predictions vs. actual values
    import matplotlib.pyplot as plt

    plt.figure(figsize=(12, 6))
    plt.plot(y_test.values, label="Actual")
    plt.plot(y_pred, label="Predicted")
    plt.xlabel("Time")
    plt.ylabel(target_col)
    plt.title("Actual vs. Predicted Bandwidth Usage")
    plt.legend()
    plt.show()

    return model
Model Validation, this came up with a MAE of about 4 gigabytes. Which I think sounds acceptable given that most 24hr periods for me are > 150GB
@step
def time_series_cross_validation(df: pd.DataFrame, target_col: str, n_splits: int = 5) -> pd.DataFrame:
    """
    Performs time series cross-validation and returns a DataFrame with the results.
    """

    # 1. Prepare the Data
    features = [col for col in df.columns if col not in [target_col, "period_start", "period_end"]]
    target = target_col
    X = df[features]
    y = df[target]

    # 2. Create TimeSeriesSplit object
    tscv = TimeSeriesSplit(n_splits=n_splits)

    # 3. Iterate Through Folds
    results = []
    for train_index, test_index in tscv.split(X):
        X_train, X_test = X.iloc[train_index], X.iloc[test_index]
        y_train, y_test = y.iloc[train_index], y.iloc[test_index]

        # Scale Features
        scaler = StandardScaler()
        X_train = scaler.fit_transform(X_train)
        X_test = scaler.transform(X_test)

        # Train the Model
        model = RandomForestRegressor(n_estimators=100, random_state=42)
        model.fit(X_train, y_train)

        # Make Predictions
        y_pred = model.predict(X_test)

        # Evaluate the Model
        mae = mean_absolute_error(y_test, y_pred)
        rmse = np.sqrt(mean_squared_error(y_test, y_pred))

        # Store Results
        results.append({
            "fold": len(results) + 1,
            "MAE": mae,
            "RMSE": rmse,
            "train_start": df["period_start"].iloc[train_index[0]],
            "train_end": df["period_start"].iloc[train_index[-1]],
            "test_start": df["period_start"].iloc[test_index[0]],
            "test_end": df["period_start"].iloc[test_index[-1]],
        })

    # 4. Aggregate Results
    results_df = pd.DataFrame(results)
    print(results_df)
    print(f"\nMean MAE: {results_df['MAE'].mean()}")
    print(f"\nMean RMSE: {results_df['RMSE'].mean()}")

    return results_df
I did get this model deployed into a docker container using FastAPI but the predictions made no sense at all. I started over, now armed with a better sense of how this works, with the actual base interval table which I think is going to provide better results.